
Distributional Cost-Effectiveness Analysis: A Case Study on Its Potential Prospects in HTA
Joshua Soboil MPH and James Morris MPH, Cogentia Healthcare Consulting Ltd, Cambridge, England, UK
Introduction
Interest in distributional cost-effectiveness analysis (DCEA) methods is growing: a DCEA paper focusing on lung cancer published in Pharmacoeconomics was the journal’s most popular article in 2023.1 This is not unexpected, as the evaluation of health equity and the influence of novel therapeutics on health outcome distribution are progressively becoming integral elements in the decision-making process of health technology assessments (HTAs). Agencies in the United Kingdom,2 the United States,3 and Canada4 are increasingly assessing health disparities or inequalities.
HTA decision makers typically deliberate the impact that a new medicine may have on health outcomes across different subgroups, such as sex, ethnicity, and socioeconomic status. But the significance of a medicine’s impact is often based on qualitative arguments and descriptive statistics.5-7 In keeping with this approach, deliberation over the extent of health inequity within the target population often involves engaging with key stakeholders, understanding patient experiences, and reviewing evidence indicating that the target population has poorer socioeconomic outcomes than the general population.6,7 Equity is an important facet to healthcare decision making, yet the process is largely driven by the primary concern of traditional cost-effectiveness analysis (CEA): allocative efficiency.6,7 The overarching question is whether to implement a particular intervention given the competing demands of a fixed healthcare budget. Traditional CEAs, therefore, attempt to answer a specific question: “What is foregone as a consequence of adopting a new intervention?” In health economics, this is generally what we mean when we talk about “opportunity costs.”8
While valuable, traditional CEA does not provide a clear, systematic estimation of how much impact a new medicine may have on health inequalities across different socioeconomic groups.7 Instead, it assumes that the costs and health benefits of a new medicine are equally distributed across a society’s population. Decision makers are therefore unable to analytically judge the potential trade-offs that can arise between efficiency and equity objectives. Simply put, while an intervention may be inefficient for some individuals within society, it could be equitable for others when equity concerns are integrated into the decision problem.7
"The significance of a medicine’s impact is often based on qualitative arguments and descriptive statistics. Equity is an important facet to healthcare decision making, yet the process is largely driven by the primary concern of traditional cost-effectiveness analysis."
So, how could we value health inequalities in a more transparent and reproducible manner? A potential solution is to use DCEA, a type of CEA that provides a quantitative assessment of equity in the distribution of costs and effects for different groups of people, as well as information on the efficiency (ie, opportunity cost of a new medicine in terms of its comparative costs and effects).7 Incorporating an aggregate DCEA, for example, into standard cost-effectiveness models for HTAs provides an approximate distributional breakdown of an intervention’s benefits, alongside the conventional CEA.7
Applying DCEA in HTA: what could it require?
In addition to conventional CEA outcomes, aggregate DCEA requires data on the distribution of relative inequality between groups for both the target and general populations, and the pre-intervention health inequalities present within the general population.
Relative inequality
A decision maker may be concerned about the health inequality between individuals in terms of biological factors, social factors, economic factors, or a combination thereof.7 Deciding on how to appropriately delineate health equity is complex and largely driven by the context of the decision problem. Arguably, however, estimating relative health inequalities is largely dependent on the disease and its social determinants.7 A simple example, which we have used in our case study, is to assume that socioeconomic status is a key determinant of health; this allows us to estimate the distribution of health inequality of different individuals based on Index of Multiple Deprivation (IMD) data.
In England, IMD data comprise 7 domains: income, employment, education, health, crime, barriers to housing and services, and living environment.9 By grouping individuals or communities based on deprivation, we can generate 5 distinct groups (or quintiles) of relative deprivation, where quintile 1 is the most deprived and quintile 5 is the least deprived.
Pre- and post-interventional health distribution
We also want to calculate the pre- and post-intervention health distribution of the general population.7 This helps us answer important questions: does the intervention take away health from the general population and give it to the target population (perhaps due to its cost)?; is it net equitable (ie, does everyone benefit?)?; or does it only benefit specific individuals? Pre-intervention health inequalities within the general population are measured using health-adjusted life expectancy (HALE) data.7 There are various types of HALE measures that estimate health-adjusted life expectancies either from birth or from illness onset.7 In our case study, we use quality-adjusted life expectancy (QALEs). Simply speaking, a QALE is quality-adjusted survival measured from birth until death.
To estimate the difference in the post- and pre-intervention health distribution across the social groups of interest, we can use metrics such as the Slope Index of Inequality (SII) or Relative Index of Inequality (RII).7 In our case study, we apply the SII, which is an absolute measure of inequality, estimated, in this case, on the same scale as the HALEs.
"The strength of DCEA is that it will clearly indicate when a new medicine has a negative impact on health inequalities for specific groups of individuals and the whole population."
Equity weighting and post-intervention equity impact
Once we have the necessary aggregate outcomes as well as the proportions of the social equity groups and their HALE data, we can analyze the distributional consequences of costs and benefits for the social groups of interest. From here, equity weights can be applied to each social group to simulate an “equal” distribution of health. We can also estimate the expected impact a medicine may have on health inequality within the target population and the total population.
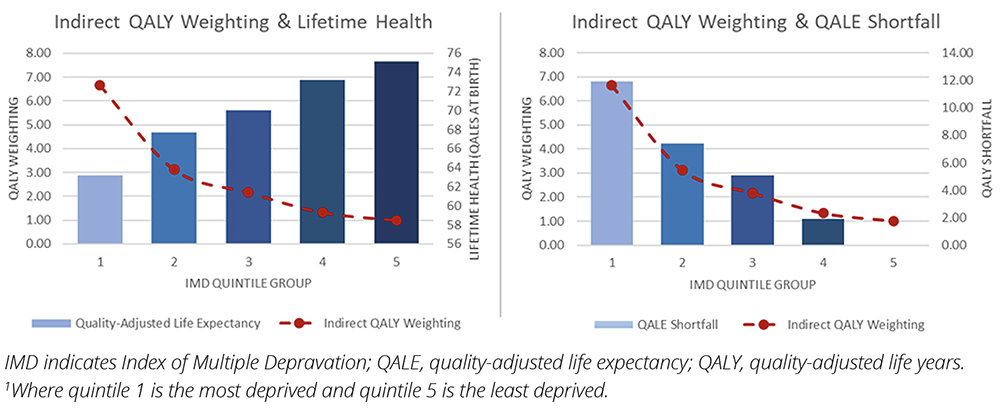
Equity weights can be thought of as the values applied to each social group that move the distribution of health outcomes to a point of equality (ie, a flat health distribution with no quality-adjusted life-year [QALY] shortfall between any of the social groups of interest) (Figure 1).7 In our case study, we apply indirect equity weights calculated using a social welfare function. The magnitude of the weighting is largely determined by an inequality aversion parameter, which determines how much a decision maker ”values” reducing health inequalities.7 Arguably, the higher the decision maker’s aversion to inequality, the more they are willing to trade off efficiency objectives in return for reductions in health inequalities. However, it is important to remember that these trade-offs are not a zero-sum game. An intervention can be both efficient and equitable. An intervention can also be efficient for some individuals but inefficient for most, while reducing health inequalities if the health benefits are largely accrued to individuals from poorer socioeconomic groups, for instance. The SII helps us to assess this impact and the associated trade-offs by indicating the magnitude and direction of the change in the pre- and postintervention health of the general population.
Figure 1. Indirect equity weights and QALY shortfall per IMD group relative to the least deprived IMD group1
A practical case study for HTA
Now that we’ve explained the concepts associated with DCEA, let’s illustrate how to apply them using a tangible case study.
In England, hepatitis C disproportionately affects more deprived socioeconomic groups, with 56% of healthcare resource utilization for the disease attributed to individuals within IMD groups 1 and 2.10 Because of this, we consider hepatitis C to be a suitable case study for aggregate DCEA in HTA. Aggregate outcomes data are derived from NICE TA507, which assessed Vosevi (sofosbuvir/velpatasvir/voxilaprevir) in direct-acting antiviral drug-naïve chronic patients with hepatitis C in England.11 The HTA reported incremental QALYs and costs of 1.24 and £20,661 respectively, producing an incremental cost-effectiveness ratio (ICER) of £16,654. For IMD quintile data, we apply Hospital Episode Statistics data to estimate the proportion of patients within each IMD quintile for the target population. For HALEs, we use QALE data for each IMD group derived from an analysis by Love-Koh et al.12 General population IMD group shares are derived from the same source, based on Hospital Episode Statistics healthcare utilization data distributed by IMD group. For the inequality aversion parameter value, a general rule is to vary this between 0 and 20. We apply an aversion to inequality parameter value of 11, which is an aversion value elicited from the UK general public.13
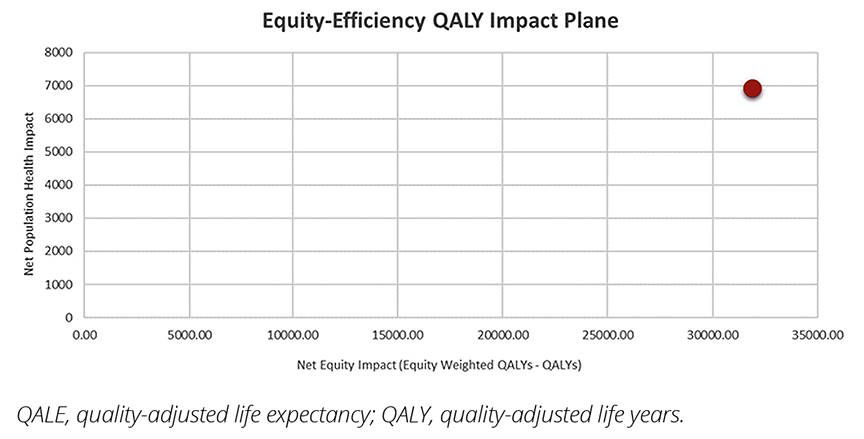
Based on the aversion to inequality parameter value of 11, the indirect equity weights applied to the incremental costs and benefits result in a relatively large (21%) reduction of the ICER reported in NICE TA507, from £16,654 to £13,074. The analysis also indicates that the intervention is net positive for overall population health and, based on the SII, it provides a large, concomitant reduction in health inequality. This is illustrated in Figure 2 using an equity impact plane, which shows an increase in both net population health and net equity impact. (For further discussion on interpreting the equity impact plane, we refer the reader to Using Cost-Effectiveness Analysis to Address Health Equity Concerns by Cookson et al).14 But does the ICER always improve when considering health inequalities?
Figure 2. Equity impact plane: Net population health versus net equity impact
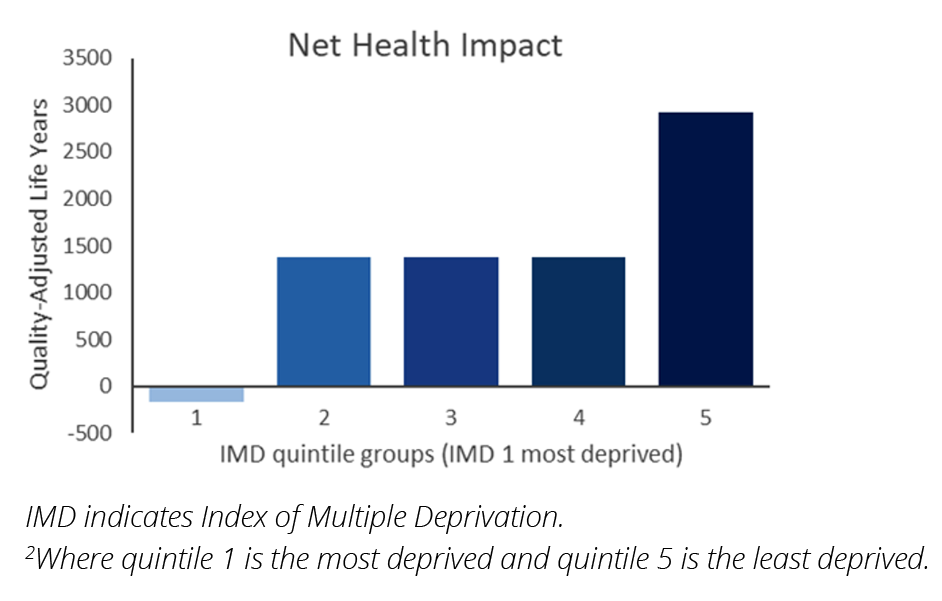
The strength of DCEA is that it will clearly indicate when a new medicine has a negative impact on health inequalities for specific groups of individuals and the whole population. If a new medicine increases health inequalities, the net health benefit, net equity impact, and ICER will move in a negative direction. If we assume that patients with hepatitis C in England are mainly distributed within the 2 least deprived IMD groups (groups 4 and 5) (ie, these groups comprise 50% of the hepatitis C population in England), the ICER increases to £20,785 and the net equity impact is negligible. In addition, the National Health Benefit for the most deprived group is negative (ie, the health of the most deprived individuals is reduced) (Figure 3). Importantly, the SII indicates there is an inequality issue: overall, health inequality is significantly increased.
Figure 3. Net health benefit distribution of case study when most patients with hepatitis C are in the least deprived IMD groups2
Developing consistency in equity and appraisal: the value of incorporating aggregate DCEA methods in HTA
DCEA provides a promising method for quantitatively assessing an intervention’s health equity impact. Despite several agencies having explicit aims to reduce health inequalities, such as NICE’s Principal 9,15 there is currently no reference case for the appropriate approach to DCEA in HTA submissions. The development of a standardized reference case is desirable because it is important to clearly understand what approach and which data (ie, which social variables, such as ethnicity, gender, or socioeconomic status) are most desired by a decision maker within the context of the decision problem. While there are more comprehensive DCEA methods to consider over and above aggregate DCEA, supplementing current standard CEA submissions with key health inequality metrics that are provided by aggregate DCEA, such as the SII, is a valuable enhancement to standard CEA in HTA.
References
1. Meunier A, Longworth L, Gomes M, Ramaglopalan S, Garrison LP, Popat S. Distributional cost-effectiveness of treatments for non-small cell lung cancer: an illustration of an aggregate analysis and its drivers. PharmacoEconomics. 2023;41:1101-1125. https://doi.org/10.1007/s40273-023-01281-8
2. National Institute for Health and Care Excellence. NICE and health inequalities. Accessed March 14, 2024. https://www.nice.org.uk/about/what-we-do/nice-and-health-inequalities
3. Institute for Clinical and Economic Review. 2020-2023 Value Assessment Framework. Published January 31, 2020 (updated October 23, 2020). Accessed March 14, 2024. https://icer.org/wp-content/uploads/2020/10/ICER_2020_2023_VAF_102220.pdf
4. Canadian Drug and Health Technology Agency. CADTH methods and guidelines, 4th edition. Published March, 2017. Accessed March 14, 2024. https://www.cadth.ca/sites/default/files/pdf/guidelines_for_the_economic_evaluation_of_health_technologies_canada_4th_ed.pdf
5. Drummond M, Sculpher M, Claxton K, Stoddart G, Torrance G. Methods for Economic Evaluation of Health Care Programmes. 4th ed. Oxford University Press; 2015
6. National Institute for Health and Care Excellence. Guide to the methods of technology appraisal. Published April 4, 2013. Accessed March 14, 2024. https://www.nice.org.uk/process/pmg9/chapter/the-reference-case
7. Cookson R, Griffin S, Norheim O, Culyer A. Distributional Cost-Effectiveness Analysis: Quantifying Health Equity Impacts and Trade-Offs. 1st ed. Oxford University Press; 2020.
8. York Health Economics Consortium. Efficiency. Published 2016. Accessed March 14, 2024. https://yhec.co.uk/glossary/efficiency/
9. National Statistics UK. English Indices of Deprivation 2019. Published September 26, 2024. Accessed March 14, 2024. https://www.gov.uk/government/statistics/english-indices-of-deprivation-2019
10. Love-Koh J, Cookson R, Gutacker N, Patton T, Griffin S. Aggregate distributional cost-effectiveness analysis of health technologies. Value Health. 2019;22(5):518-526. https://doi.org/10.1016/j.jval.2019.03.006
11. National Institute for Health and Care Excellence. TA507: Sofosbuvir-velpatasvir-voxilaprevir for treating chronic hepatitis C. Published February 21, 2018. Accessed March 11, 2024. https://www.nice.org.uk/guidance/ta507
12. Love-Koh J, Cookson R, Claxton K, Griffin S. Estimating social variation in the health effects of changes in health care expenditure. Medl Decis Making. 2020;40(2):170-182. https://doi.org/10.1177/0272989X20904360
13. Robson M, Asaria M, Cookson R, Tsuchiya A, Ali S. Eliciting the level of health
inequality aversion in England. Health Econ. 2017;26(10):1328-1334. https://doi.org/10.1002/hec.3430
14. Cookson R, Mirelman A, Griffin S, et al. Using cost-effectiveness analysis to address health equity concerns. Value Health. 2017; 20:206-212. https://doi.org/10.1016/j.jval.2016.11.027
15. National Institute for Health and Care Excellence. Our Principles. Accessed March 14, 2024. https://www.nice.org.uk/about/who-we-are/our-principles
Acknowledgments: We thank Joanna Todd (Cogentia Healthcare Consulting Ltd) for editorial assistance.
