
Methods for Estimating Healthy Life Expectancy
Andrew Pijper, MMath, Jamie Kettle, MMath, and Catrin Treharne, MSc, LCP Health Analytics, London, England, United Kingdom
Introduction
Healthy life expectancy (HLE) is an important public health metric that measures not only how long people live, but also how well they live, providing valuable information that can guide health policy decisions. In this article we explore 2 methods—the Sullivan method and multistate Markov models—which are both widely used for HLE calculations but vary in their data requirements, calculation complexity, and applicability.
What is HLE?
HLE measures the expected number of future years spent in ”good health” from any given age.1 For calculating HLE, good health is assumed to be a binary concept (ie, an individual is either in good health or not).2 This contrasts with other measures (eg, quality-adjusted life expectancy), which use a more granular definition of health.
Considered alongside life expectancy, HLE can provide an indication of overall population health levels as well as highlighting disparities between different population groups, such as groups defined by geography or deprivation.3 The UK government’s 2022 Levelling Up White Paper included the following as 1 of its 12 missions: to increase national HLE by 5 years by 2035 and to narrow the HLE gap between the least and most advantaged areas in the United Kingdom by 2030.4 This HLE gap currently stands at 14 years.5 HLE is also an important concept in other high-income geographical areas such as the United States, Canada, and the European Union.6
How is HLE measured?
There are various methods to calculate HLE, with the appropriate choice guided by the available data.1 However, the most used methods are variations or extensions of 2 principal methods that we describe in this article:
- Sullivan method: a prevalence-based approach using cross-sectional data at a point in time. A variation of this method is to apply health weights at each age reflecting the aggregated level of disability or illness in the population, instead of estimating the proportion of individuals in good health.7
- Multistate Markov models: an incidence-based approach requiring longitudinal data over time. Extensions include multistate models that relax the Markov assumption of dependence only on the present state and make allowance for the duration of illness (semi-Markov models).8
A comparison of methods
Sullivan method
The Sullivan method is the most widely adopted for calculating HLE,6 employed across national statistics, epidemiological research, and public health assessment. It is a prevalence-based method relying on information about the proportion of patients in good health at different ages in the population. For example, in its latest HLE release for the period between 2018-2020, the Office for National Statistics used data from the Annual Population Survey and the 2011 Census.2
The data inputs required to calculate HLE using the Sullivan method are:
- Mortality rates for each age band; and
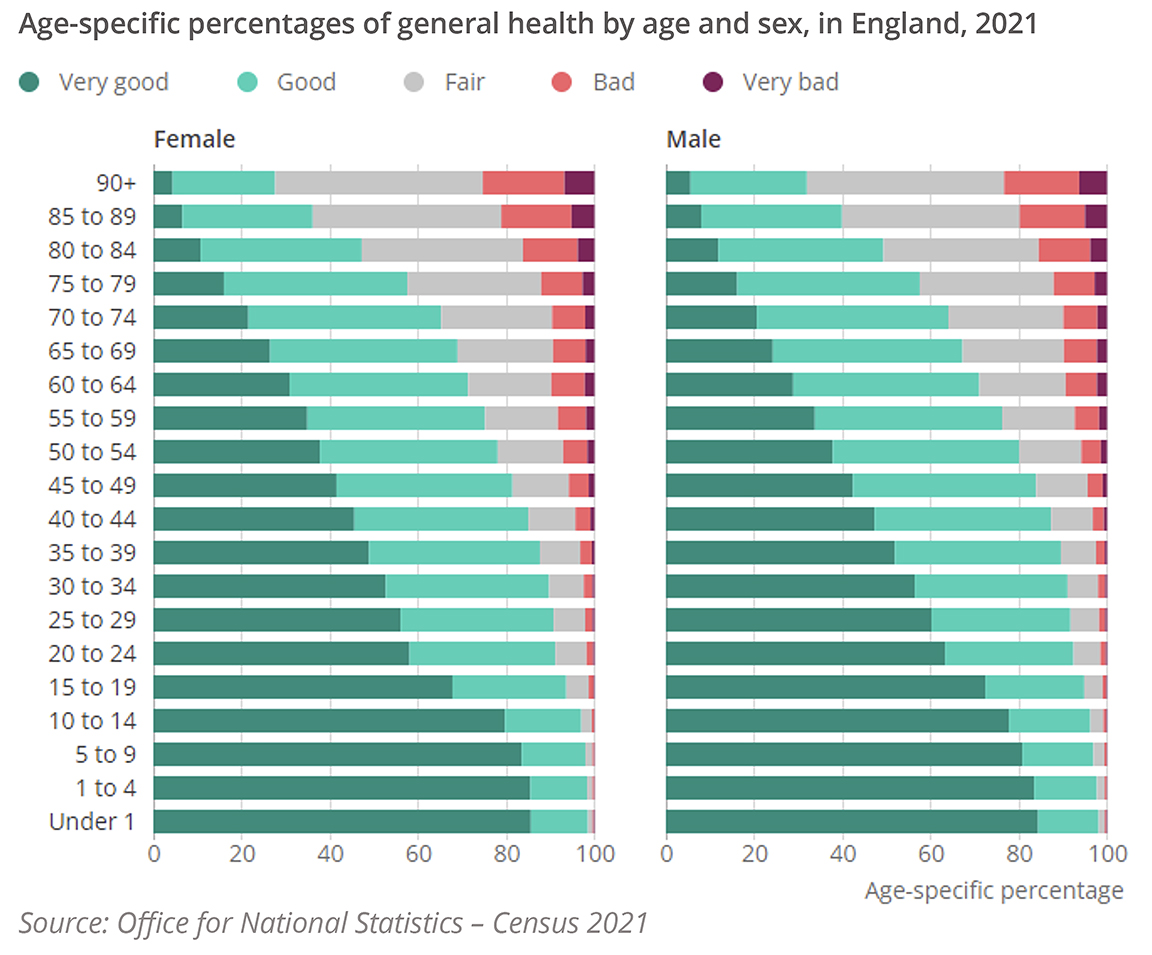
- Proportion in good health (“health prevalence”) within each age band (Figure 1)
Figure 1. Percentages of general health for males and females, 2021 Census. Health prevalence is taken as the proportion in “Good” or “Very good” health
The steps in the calculation process are:
- Graduate the mortality and health prevalence rates if necessary. Graduation is a statistical technique used to produce rates that are a smooth function of age.9 Various graduation methods are available, from assuming a simple relationship to a published actuarial table (eg, a multiplicative scaling) to complex methods such as fitting spline functions.10 Whether graduation is necessary, and the choice of graduation method, depends on the quality of data being used and the need for precision in the resulting HLE estimates.
- Construct a life table from the mortality rates. A life table is a tool widely used in actuarial science to analyze the mortality of a population. It tracks a hypothetical cohort of “lives” across different age bands (typically single years of age), recording the number surviving to each age.
- Multiply the number of lives in each age band by the health prevalence rate to estimate the number of healthy lives in that age band. This effectively creates a second life table tracking only those in good health.
- In each age band, prospectively sum the number of (a) lives and (b) healthy lives over all future age bands and divide by the number of lives in the age band to estimate the (a) life expectancy and (b) healthy life expectancy. This calculation typically includes values for the current age band.
The Office for National Statistics provides more detailed, step-by-step instructions on how to construct a life table11 and a spreadsheet template for carrying out steps 2-4 above.12
The outputs are period life expectancy and healthy life expectancy, measuring a snapshot of the population’s health at the point in time to which the mortality and health prevalence rates relate. Future changes in mortality and morbidity (“cohort effects”) are not automatically accounted for, although these can be built into the calculation separately by projecting the mortality and health prevalence rates based on the user’s expectation of future trends. While period HLE provides a metric of overall population health at a given point in time, allowing for cohort effects can provide more meaningful HLE estimates at the individual level.
Markov models
Multistate Markov models are an incidence-based method defined by a system of states that represent the different health states an individual could occupy at any given time. Individuals move through the states over time, with this movement between states modeled by a set of transition probabilities. The Markov property (or ”memoryless” property) means that the probability of an individual transitioning to a new state depends only on their current state and not on their history.
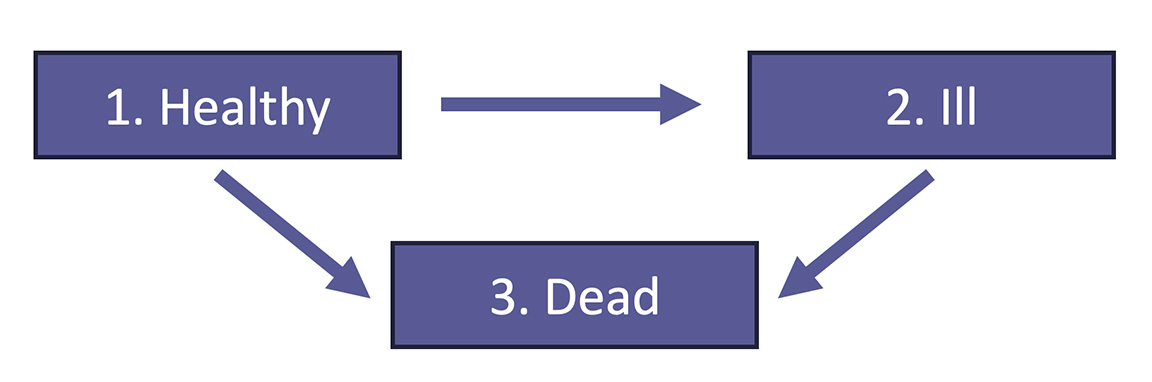
To model HLE, a 3-state illness-death model is used, containing transitions between healthy, ill, and dead states (Figure 2). In this example, we ignore recoveries (transitions from the ill state to the healthy state), although other versions of this model allow for these.13
Figure 2. Illustration of multiple state model for estimating healthy life expectancy
Markov models can be regression-based (fitted to longitudinal data on patient health trajectories) or non-regression-based (with transition probabilities based on other sources such as published literature). For regression-based models, the calculation proceeds as follows:
- Estimate the transition probabilities between each pair of states. This can be done using packages such as msm14 in R which fits a multistate Markov model using maximum likelihood estimation.
- Construct the survival curve for the healthy state. Here, “survival” refers to staying in the healthy state. The survival curve measures the probability of remaining in the healthy state for a given length of time.
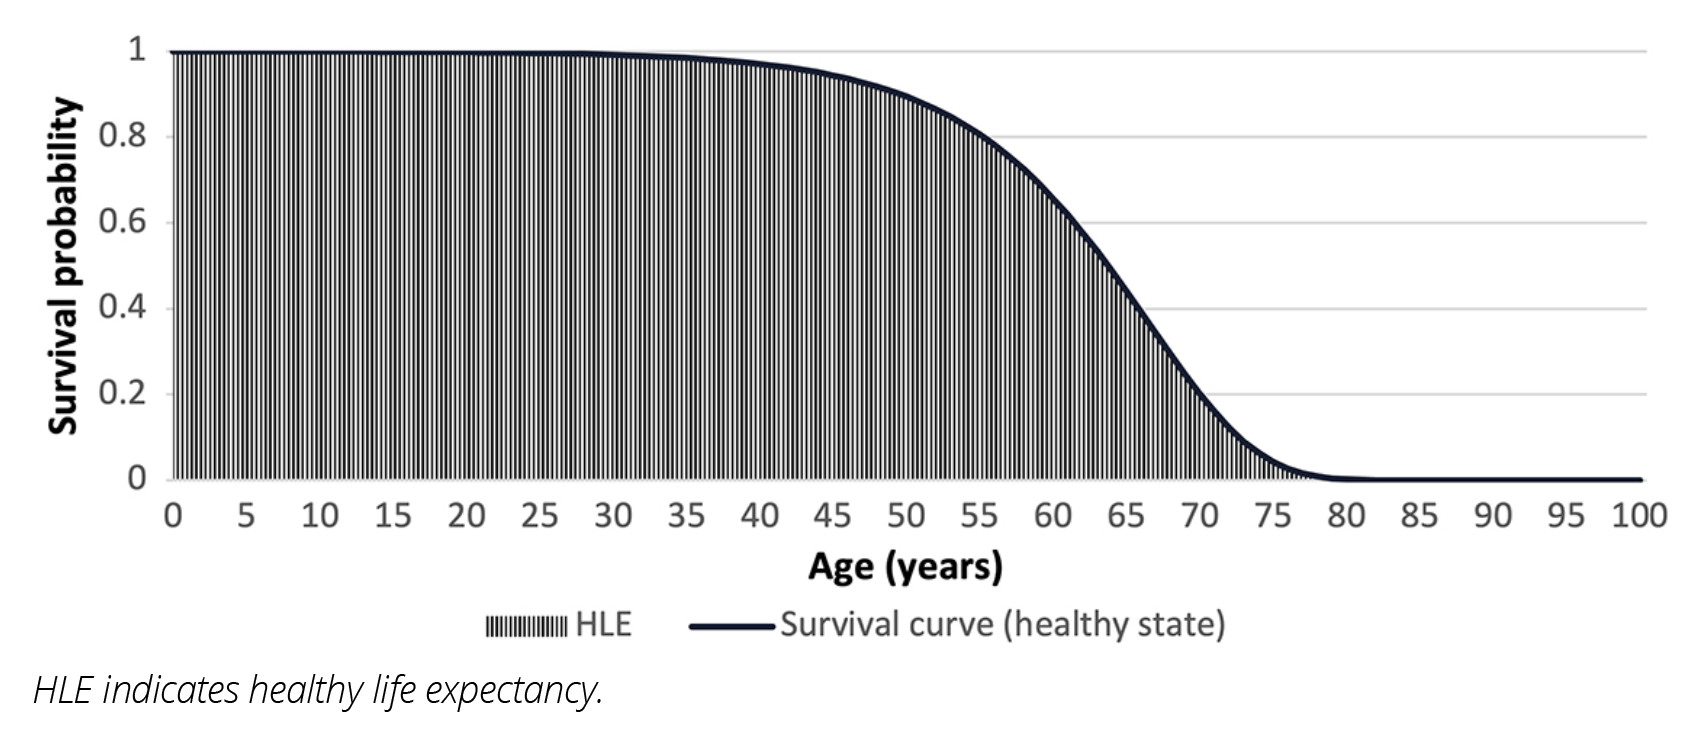
- Estimate the area under the survival curve. Since HLE is the expected length of time spent in the healthy state, it can be estimated as the area under the survival curve (Figure 3), eg, using the AUC function in R.
Figure 3. Example survival curve for the healthy state. HLE is the area under the curve
Continuous-time Markov multi-state model
In a continuous-time Markov model, the transitions can occur at any time. For these types of models, steps 2 and 3 can be completed simultaneously in R by using the ELECT package13 on the msm-fitted model to estimate the area under the survival curve via numerical integration.
Discrete-time Markov multistate model
In a discrete-time Markov model, the transitions can only occur at specific, evenly spaced points in time. In this case, steps 2 and 3 are completed separately and can be implemented outside of R (eg, in a spreadsheet):
- Choose a starting age x. The total probability of remaining in the healthy state until age x+n is the product of the individual probabilities of remaining in the healthy state for each age, from age x to age x+n. Calculating this probability for all terms n produces the survival curve for the healthy state from age x.
- HLE at age x is then estimated by summing these probabilities for all ages greater than or equal to x.
Lessons learned
In recent analysis, we have found similar estimates of both life expectancy and HLE when comparing these methods, demonstrating their interoperability and offering flexibility for researchers.15
The choice of method should be informed by the available data and purpose of the calculation. The Sullivan method can be applied using more widely collected input data and provides a good estimate of HLE based on the makeup of the population at the time of data collection.
While data requirements are more complex, the Markov multistate models can provide a better estimation of expected health over the lifetime of a cohort based on current mortality and morbidity conditions. A second advantage is that the msm package can be used to fit hidden Markov models, which may be relevant if the observed data contain misclassifications of an individual’s true state.
Implications for stakeholders
Healthy life expectancy is a vital instrument for evaluating population health, facilitating the assessment of health inequalities across demographic groups—such as those distinguished by geography, deprivation, sex, or ethnicity—and measuring the effectiveness of health interventions, ranging from public policies to medical treatments. The UK government has set out to reduce health inequalities by 2030, and tools like HLE are a way to measure progress and hold them to account. The pharmaceutical industry can also apply these methods to estimate life expectancy and HLE improvements generated by their products (eg, by leveraging clinical trial data).
Acknowledgments
The authors would like to thank the following collaborators, all of LCP Health Analytics, for their contributions to this article: Maisie Borrows for suggesting that we reach out to Value & Outcomes Spotlight and providing helpful guidance on the format of the article, Avneet Gill for proof-reading draft versions and contributing to supplementary material, and Mei Sum Chan for technical review of the final draft and assisting at the publication stage.
References
- Saito Y, Robine JM, Crimmins EM. The methods and materials of health expectancy. Stat J IAOS. 2014;30(3):209-223. doi: 10.3233/SJI-140840
- Office for National Statistics. Health state life expectancies, UK: 2018 to 2020. Published March 4, 2022. Accessed April 26, 2024. https://www.ons.gov.uk/peoplepopulationandcommunity/healthandsocialcare/healthandlifeexpectancies/bulletins/healthstatelifeexpectanciesuk/2018to2020
- LCP Media Centre. New analysis reveals stark picture of health disparities across England. Published October 20, 2021. Accessed April 26, 2024. https://www.lcp.com/media-centre/2021/10/new-analysis-reveals-stark-picture-of-health-disparities-across-england
- GOV.UK. Levelling Up the United Kingdom. Published February 2, 2022. Accessed November 21, 2023. https://www.gov.uk/government/publications/levelling-up-the-united-kingdom
- Pijper A, Chan MS, Xie P, Cairns A, Mayhew L. HPR35 Modelling the effects of smoking on healthy life expectancy (HLE) in England. Value Health. 2023;26(12):S260.
- Stiefel MC, Perla RJ, Zell BL. A healthy bottom line: healthy life expectancy as an outcome measure for health improvement efforts. Millbank Q. 2010;88(1):30-53. doi: 10.1111/j.1468-0009.2010.00588.x
- Kim Y-E, Jung Y-S, Ock M, Yoon S-J. A review of the types and characteristics of healthy life expectancy and methodological issues. J Prev Med Public Health. 2022;55(1):1-9. doi: 10.3961/jpmph.21.580
- Belanger A. Multistate life table with duration dependence: an application to Hungarian female marital history. Eur J Popul. 1990;5(4):347-372. doi: 10.1007/BF01796792
- Ramonat S, Kaufhold K. A Practitioner’s Guide to Statistical Mortality Graduation. Society of Actuaries. Published April 2018. Accessed April 26, 2024. https://www.soa.org/49347d/globalassets/assets/files/resources/tables-calcs-tools/2018-stat-mort-graduation.pdf
- Tang K H, Dodd E, Forster JJ. Joint modelling of male and female mortality rates using adaptive P-splines. Ann Actuar Sci. 2022;16(1):119-135. doi: https://doi.org/10.1017/S1748499521000105
- Office for National Statistics. Guide to calculating national life tables. Published January 21, 2019. Accessed April 2, 2024. https://www.ons.gov.uk/peoplepopulationandcommunity/healthandsocialcare/healthandlifeexpectancies/methodologies/guidetocalculatingnationallifetables
- Office for National Statistics. Health state life expectancy estimates template. Published March 26, 2024. Accessed April 2, 2024. https://www.ons.gov.uk/peoplepopulationandcommunity/healthandsocialcare/healthandlifeexpectancies/datasets/healthstatelifeexpectancytemplate
- van den Hout A, Chan MS, Matthews F. Estimation of life expectancies using continuous-time multi-state models. Comput Methods Programs Biomed. 2019;178:11-18. 0169-2607. doi: https://doi.org/10.1016/j.cmpb.2019.06.004
- Jackson C. Multi-state models for panel data: the msm package for R. J Stat Soft. 2011;38(8):1-28. doi: https://doi.org/10.18637/jss.v038.i08
- Kettle J, Treharne C, Chan MS. PT18 Novel Approaches to Unify Multi-State Transition Modelling Methods and Develop a Synthetic English Population to Support Health Economic Evaluation Studies. Value Health. 2023 26(12):S426.
