Where Are Populations Aging Better?
Where are populations aging better? A global comparison of healthy aging across Organization for Economic Cooperation and Development countries
Rapp T, Ronchetti J, Sicsic J, Value Health. 2022;25(9): 1520-1527. https://doi.org/10.1016/j.jval.2022.05.007
Introduction
Population aging is a well-documented process happening in many countries. However, the concept of healthy aging—defined by the World Health Organization as “the process of developing and maintaining the functional ability that enables well-being in older age”—is less well researched, partly because this is a complex problem that is hard to define and measure.1 Previous work in this area focused on dissecting differences observed between life expectancy and quality-adjusted life expectancy at the population level. Rapp and colleagues use the theoretical framework by Grossman2 on health capital (ie, where health is a durable stock that depreciates over time but can be maintained/restored by investment) to model healthy aging on an individual level. The authors develop an original microeconomic approach to estimate individuals’ physiological age from self-reported health data and compare it against their chronological age to describe the extent of healthy aging across countries.
The analysis uses data between 2004 and 2014 based on 2 multicountry surveys: (1) the Health and Retirement Survey (HRS) in the United States, and (2) the Survey of Health, Aging, and Retirement in Europe (SHARE) that includes 12 countries (Austria, Belgium, Denmark, France, Germany, Greece, Israel, Italy, The Netherlands, Spain, Sweden, and Switzerland). The population was restricted to people aged 60-89 years, and to participants having at least 3 observations (39,164 individuals).
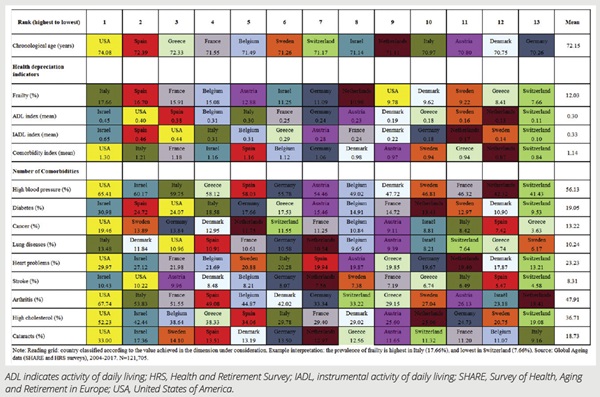
The authors model the contribution of specific factors known to impact health—namely, frailty, limitations on the activities of daily living, and comorbidities (eg, high blood pressure and cancer)—on self-reported health status and interpret these in term of aging (Figure 1). The authors used dynamic correlated random effect model and marginal impact of health depreciation variables instead of raw self-reported health scores to account for bias of cultural reporting. Several sensitivity analyses and validation exercise have been done to examine if results are robust.
Figure 1. Ranking of countries according to chronological age and prevalence of health depreciation indicators (descriptive statistics)

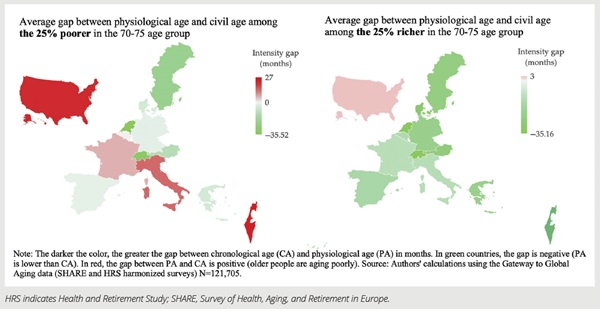
The authors presented cross-country data on the difference between physiological age and chronological age for the middle of their data cohort: ages 70-75 years, considering that cross-country differences are potentially larger in this age range (Figure 2). They found that physiological age exceeds chronological age in the United States, Israel, and Italy. The authors contrast that with findings in Switzerland, The Netherlands, Greece, and Sweden that performed well (eg, Switzerland’s result of -32 months physiological age to chronological age). The differences remained consistent in other age groups, even in the oldest age group analyzed.
Figure 2. Average difference between physiological age and chronological age (in months) in the 70 to 75-year age group.

The paper also presents inequalities in lower- and upper-income quartiles of each country, comparing them by average physiological age/chronological age differences. Widest differences were observed in the lower-income quartile (27 to -35.52 months); in the United States and Israel, the people’s average physiological age is more than 2 years higher than their chronological age. Interestingly, even for people in the upper-income quartile, living in the United States is associated with positive physiological age/chronological age differences (poor aging), while in all other countries, this difference is rather negative. When exploring the socioeconomic determinants of the physiological age/chronological age difference, the authors found that that completing higher education, having higher income, and living as a couple contribute most to healthy aging. For example, completing tertiary education on average reduces the physiological age by 1.3 years compared to the chronological age.
Apart from shedding light on intercountry differences in healthy aging, there are policy implications of the study. Retirement age, preventive measures, or healthcare interventions, such as screening and vaccination, are based solely on chronological age. Although this is administratively very simple and convenient, likely better effectiveness for social policy measures and decisions could be achieved by using the physiological age. With the methodology put forward in this research paper, the physiological age can be relatively easily calculated and used for research and for policy decision making.
References
1. World Health Organization. World report on ageing and health. Published 2015. Accessed September 27, 2022. https://apps.who.int/iris/handle/10665/186463
2. Grossman M. On the concept of health capital and the demand for health. J Polit Econ. 1972;80:223-255.

