Researcher Difficulties Using Secondary Data Sources to Generate Real-World Evidence: Results From an Online Survey
David Thompson, PhD, Rubidoux Research LLC, Manchester-by-the-Sea, MA, USA

Introduction
Analyses of secondary data sources, such as billing claims and electronic health records (EHRs), have been a mainstay of health economics and outcomes research (HEOR) for more than forty years. During that time, the field has seen widespread proliferation of real-world data (RWD) sources, technological innovations to enable data linkages, refinements of analytic methods to limit bias and confounding, and articulation of real-world evidence (RWE) use cases by payers, regulators, and other health system stakeholders. An entire RWD/RWE ecosystem has emerged in virtually every country where data on patient encounters with the medical care system are stored electronically. ISPOR and other professional organizations offer training in RWD analytics, and the field of data science has emerged as an academic discipline to enable the next generation of analysts to become credentialed in the latest tools and techniques, including artificial intelligence (AI).
"An entire RWD/RWE ecosystem has emerged in virtually every country where data on patient encounters with the medical care system are stored electronically."
With all these developments, it is an
open question as to what extent generation of RWE from secondary RWD sources
remains a challenge. Has the expanding array of available and linkable data
sources made identifying those that will meet one’s research objectives an
easier or more daunting task? Have the methodologic advances for analyzing RWD
made identifying the study design and selecting the statistical techniques more
straightforward or more confusing, requiring greater sophistication to sort
through? And with a growing body of literature describing past studies to draw
from, is the task of defining computable operational definitions to select
study patients, assemble them into comparison groups, track their comorbidities
and concomitant medications, and assess treatment outcomes a less painstaking
undertaking, or more?
This paper reports results from an online survey that was conducted to gain insights into the degree of difficulty researchers have identifying, evaluating, and analyzing secondary RWD sources to generate RWE.
Survey Design & Implementation
The anonymous online survey was fielded during the period of February to May 2024. The survey first asked researchers for their professional affiliation and experience conducting RWD analyses in the past 5 years (categorized as 1-5, 6-19, 20-49, 50+ studies), then for responses to the following items using a 7-point Likert scale (from 1 = “very difficult” through 7 = “very easy”):
- Drawing on your experience in conducting these [RWD] analyses over the past 5 years, in those instances in which you were involved in identifying fit-for-purpose RWD sources, please rate how difficult or easy you found it on average. (Hereafter referred to as “Identifying RWD Sources.”)
- Drawing on your experience in conducting these analyses over the past 5 years, in those instances in which you were involved in assessing the quality & completeness of the RWD sources, please rate how difficult or easy you found it on average. (“Evaluating RWD Sources.”)
- Drawing on your experience in
conducting these analyses over the past 5 years, in those instances in which
you were involved in identifying
a rigorous study design, please rate how difficult
or easy you found it on average. (“Identifying Study Design.”)
- Drawing on your experience in
conducting these analyses over the past 5 years, in those instances in which
you were involved in
identifying appropriate codes (eg, ICD, CPT, NDC, etc) and developing
algorithms to select study patients, please rate
how difficult or easy you found it on average. (“Coding Study Patients.”)
- Drawing on your experience in
conducting these analyses over the past 5 years, in those instances in which
you were involved in identifying
appropriate codes (eg, ICD, CPT, NDC, etc) and developing algorithms to select
interventions of interest and assign patients to treatment groups, please rate how difficult or easy you found it on average.
(“Coding Treatment Groups.”)
- Drawing on your experience in
conducting these analyses over the past 5 years, in those instances in which
you were involved in
identifying appropriate codes (eg, ICD, CPT, NDC, etc) and developing
algorithms to specify patient covariates of interest (eg, comorbidities,
concomitant medications), please rate how difficult
or easy you found it on average. (“Coding Patient Covariates.”)
- Drawing on your experience in
conducting these analyses over the past 5 years, in those instances in which
you were involved in
identifying appropriate codes (eg, ICD, CPT, NDC, etc) and developing
algorithms to specify outcomes of care, please rate
how difficult or easy you found it on average. (“Coding Treatment Outcomes.”)
- Drawing on your experience in conducting these analyses over the past 5 years, in those instances in which you were involved in selecting the statistical methods, please rate how difficult or easy you found it on average. (“Selecting Statistical Methods.”)
A final item asked respondents to rank order these items directly from most to least difficult.
"Is the task of defining computable operational definitions to select study patients, assemble them into comparison groups, track their comorbidities and concomitant medications, and assess treatment outcomes a less painstaking undertaking, or more?"
Survey Findings
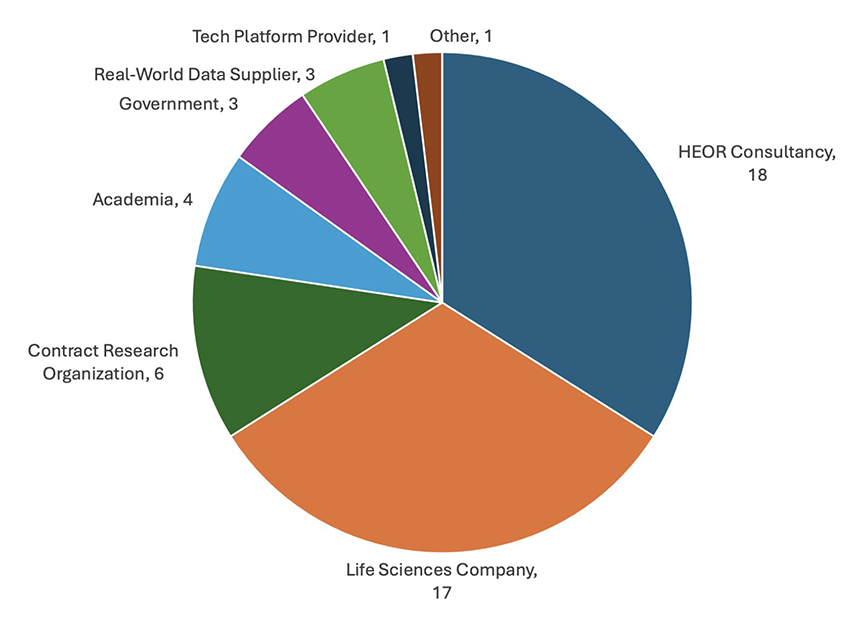
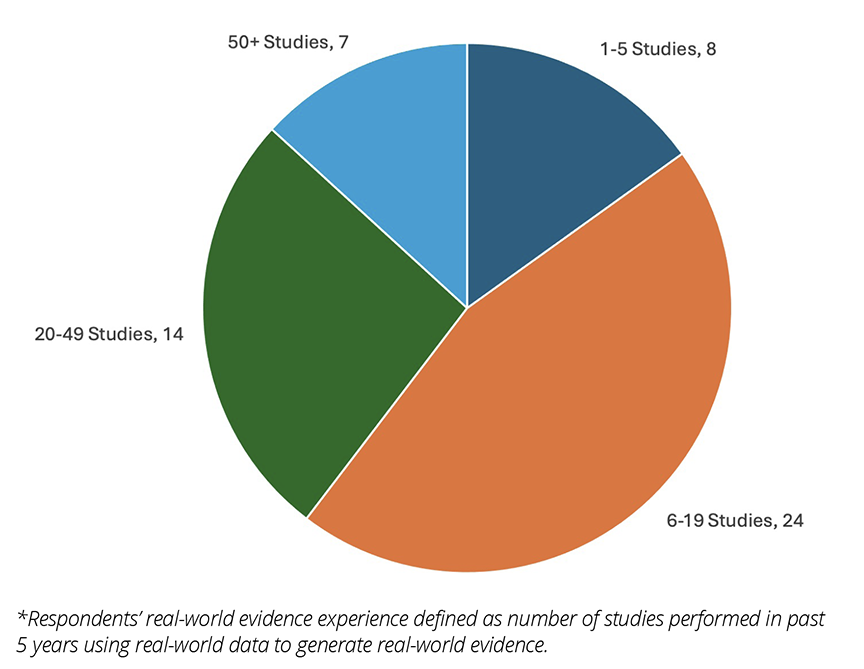
A total of 53 researchers completed the survey. Most survey respondents worked for HEOR consultancies or life sciences companies (Figure 1) and the vast majority had performed at least 6 analyses of RWD in the past 5 years (Figure 2).
Respondents directly ranked “Evaluating RWD Sources” as the most difficult task, followed (in descending order) by “Identifying RWD Sources,” “Coding Treatment Outcomes,” “Coding Treatment Groups,” “Coding Study Patients,” “Identifying Study Design,” “Coding Patient Covariates,” and “Selecting Statistical Methods.”
Figure 1. Distribution of Survey Respondents by Professional Affiliation

Figure 2. Distribution of Survey Respondents by Real-World Evidence Experience*

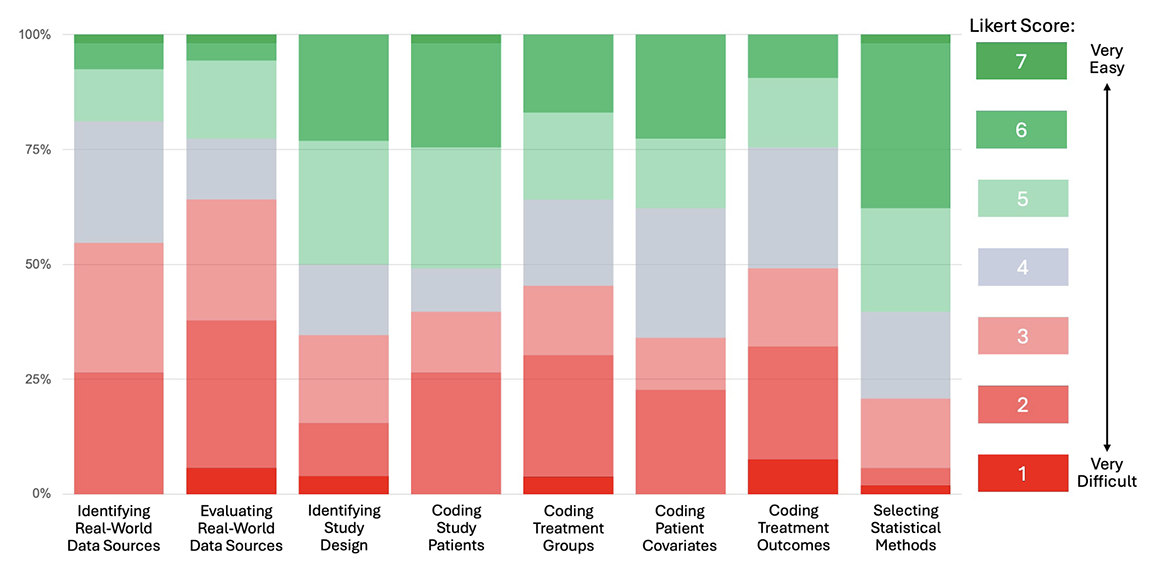
These rankings are consistent with the distribution of item responses summarized in the 100% stacked bar chart depicted in Figure 3. The color scheme is anchored by cool gray for the neutral response (Likert score of 4) in the center of the 7-point scale, with shades of red for difficult responses (1 to 3), and shades of green for the easy responses (5 to 7). This enables quick visualization of respondents’ degrees of difficulty with each of the survey items, with those that are predominantly red being relatively more difficult than those predominantly green. The 100% stacked bar format also allows evaluation of the median (50th percentile) and interquartile range (25th to 75th percentile) of the item responses.
The bar chart shows fairly distinct tiers in terms of researcher difficulties with RWD, with the upfront work of identifying and evaluating RWD sources in the top tier, coding of the data to create analytic files in the next tier, and study design and statistical methods in the lowest tier. It is also interesting to examine how often survey respondents rated items at 4 (ie, as neither difficult nor easy). What stands out is that relatively few respondents used this rating for “Coding Study Patients,” yielding a largely bimodal distribution concentrated in the hard and easy ranges of responses, whereas responses for “Coding Patient Covariates” were more normally distributed, with 4 being the most frequently chosen rating.
Figure 3. Distribution of Item Responses (100% Stacked Bar)

Subgroup analyses of differences in scale scores by professional affiliation and RWD experience yielded some interesting insights (data not shown graphically). One insight is that experience matters, as there was a clear trend across all items towards higher Likert scores (signifying less difficulty) across the progressive experience categories (ie, 1-5, 6-19, 20-49, and 50+ studies performed in the past 5 years). Differences in Likert scores also were observed by reported professional affiliation. Those working in HEOR consultancies or contract research organizations generally found it more difficult to identify and evaluate RWD sources, and less difficult to construct the analytic files (ie, code study patients, treatment groups, patient covariates, and treatment outcomes) and select the statistical methods. Across most items, the opposite was the case for those working in life sciences companies, as respondents found identifying and evaluating RWD sources somewhat easier and performing the analytics somewhat harder.
"Researchers reported identifying and evaluating secondary data sources to be the most vexing aspects of using RWD to generate RWE."
Conclusions & Implications
In this survey, researchers reported identifying and evaluating secondary data sources to be the most vexing aspects of using RWD to generate RWE. Developing code-based algorithms to create the analytic data files (ie, coding study patients, treatment groups, covariates, and outcomes) are somewhat less difficult, with selection of study design and statistical methods relatively straightforward in comparison.
The reported difficulties in assessing RWD sources are interesting considering just how much the RWD/RWE ecosystem has developed in recent years. Guidance documents and checklists for matching RWD sources to research needs/objectives have been issued by ISPOR,1-2 the US Food & Drug Administration (FDA),3 and various policy groups (eg, Duke-Margolis RWE Collaborative).4-5 Some private enterprises have marketed technology platforms to facilitate RWD source identification and evaluation, and even act as brokers for contracting and transfer of data. Whether these efforts have been underutilized, ineffective, or merely need more time to take root is unknown, but the survey results clearly point to RWD identification and evaluation as areas requiring continued attention.
This stands in contrast to issues related to real-world research design and selection of statistical methods for data analysis. Here too, much effort has been made over the past 2 decades to elevate the scientific rigor of research based on RWD, with important contributions from various academic and policy groups as well as both the FDA and European Medicines Agency. ISPOR also has taken an active role in providing good research practices guidance and educational support programs to researchers interested in generating RWE from secondary RWD sources. Based on the survey findings, it appears that collectively these efforts have indeed made the task of research design and selection of analytic methods relatively easier than other tasks.
The importance of developing “computable phenotypes”—or, more broadly, “computable operational definitions”—has garnered increased attention in recent years. In its guidance document, FDA suggests that “[s]tandardized computable phenotypes enable efficient selection of study populations and ascertainment of outcomes of interest or other study variables for large-scale clinical studies across multiple healthcare systems.”3 To date, however, not enough progress has been made to curate a readily accessible set of standardized and validated computable operational definitions, leading to inefficiencies in conduct of the research. This is confirmed by the survey findings, in which nearly one third of the respondents ranked one of the coding items as the single-most difficult aspect of RWD-based analyses.
In conclusion, this survey highlights the differential progress that has been made in the various aspects of using sources of RWD to generate RWE and points to areas of continued need in the years ahead. Periodic implementation of this survey over time will permit assessment of our continued progress, as this approach to RWE generation increases in importance to health system stakeholders.
References
- Fleurence RL, Kent S, Adamson B, et al. Assessing real-world data from electronic health records for health technology assessment: the SUITABILITY checklist: a good practices report of an ISPOR Task Force. Value Health. 2024;27(6):692-701.
- Motheral B, Brooks J, Clark MA, et al. A checklist for retroactive database studies: report of the ISPOR Task Force on Retrospective Databases. Value Health. 2003;6(2):90-97.
- US Department of Health and Human Services, Food and Drug Administration, Center for Drug Evaluation and Research (CDER) and Center for Biologics Evaluation and Research (CBER) and Oncology Center for Excellence (OCE). Real-World Data: Assessing electronic health records and medical claims to support regulatory decisionmaking for drug and biological products: Guidance for Industry. July 2024. https://www.fda.gov/media/152503/download
- Daniel G, McClellan M, Silcox C, Romine M, Bryan J, Frank K. Characterizing RWD Quality and Relevancy for Regulatory Purposes. Duke-Margolis Center for Health Policy; October 1, 2018. https://healthpolicy.duke.edu/publications/characterizing-rwd-quality-and-relevancy-regulatory-purposes-0
- Mahendraratnam N, Silcox C, Mercon K, et al. Determining Real-World Data’s Fitness for Use and the Role of Reliability. Duke-Margolis Center for Health Policy; September 26, 2019. https://healthpolicy.duke.edu/sites/default/files/2019-11/rwd_reliability.pdf

