A New Frontier in Health Economics and Outcomes Research: Generalizing Clinical Trial Outcomes to Real-World Settings
Devin Incerti, PhD, EntityRisk, San Francisco, USA; Andrew Morris, BA, EntityRisk, San Diego, USA; Joseph C. Cappelleri, PhD, Pfizer, Connecticut, USA; Valeria Merla, MPH, Pfizer, New York, USA; Nate Posner, MPH, Pfizer, New York, USA; Dana P. Goldman, PhD, University of Southern California and EntityRisk, Los Angeles, USA; Darius N. Lakdawalla, PhD, University of Southern California and EntityRisk, Los Angeles, USA

Introduction
For new medicines, and even many established ones, evidence of effectiveness rests primarily on data from a pivotal clinical trial designed for regulatory approval. Yet, in nearly all cases, clinical trial participants differ significantly from real-world patients who use the drug. This issue came into sharp relief over the past few years as novel treatments for Alzheimer’s disease emerged.
In 2021, the US Food and Drug Administration (FDA) approved aducanumab, the first therapy targeting the fundamental pathophysiology of the disease. Aducanumab was the first Alzheimer’s drug approved by the FDA in almost 2 decades; and its approval reflected the dire need of patients suffering from Alzheimer’s disease. Indeed, the FDA approved aducanumab through its accelerated approval pathway that emphasizes surrogate endpoints—in this case, positron emission tomography imaging showing that it reduced amyloid beta plaque accumulating in the brain.1
The Centers for Medicare & Medicaid Services (CMS), which runs the Medicare program, was not as sanguine about aducanumab’s efficacy in their population.2 CMS also fretted about the potential cost. Indeed, CMS announced that 2022 premiums in Part B—the program responsible for paying for aducanumab—would reflect the largest premium increases ever.3 Given these cost and efficacy concerns, CMS proposed a novel evidence development policy4—only Medicare patients enrolled in randomized clinical trials would be eligible for coverage. In effect, Medicare was mandating additional clinical trials, for their covered population, after FDA approval.
The policy seemed misguided. For example, if randomization is blinded, it meant that Medicare beneficiaries assigned to placebo might still have to pay out-of-pocket costs. In the wake of patient uproar, CMS ultimately relaxed their policy for all drugs in this space. Rather than relying on randomized clinical trials, CMS now requires treated patients to be part of clinical registries as a condition for coverage. In effect, CMS chose to “support the collection of real-world information to study the usefulness of these drugs for people with Medicare.”5
"For new medicines, evidence of effectiveness rests primarily on data from a pivotal clinical trial designed for regulatory approval. Yet, in nearly all cases, clinical trial participants differ significantly from real-world patients who use the drug."
This conundrum plays out in many countries, patient populations, and therapeutic areas. Manufacturers must support their pricing based on real-world effectiveness, payers must make reimbursement and access determinations, and clinicians and patients must make treatment decisions. The challenges are further magnified in rare disease treatments, where trials may involve relatively few patients.
Fortunately, credible and rigorous methods exist for generalizing health outcomes to real-world populations of interest. They remain underused and underappreciated in comparative effectiveness research, perhaps due to their complexity. In this article, we describe these methods and offer a path to more reliable estimates of comparative effectiveness, even in rare diseases with small sample sizes. We illustrate our findings with an application to Duchenne muscular dystrophy (DMD) gene therapy.
Probabilities, not averages
When predicting real-world outcomes, a common pitfall is to focus on average health outcomes. This may seem attractive since clinical trials typically read out mean (or median) outcomes. However, focusing on averages hides information pertinent to decision makers. Empirical research demonstrates that patients themselves care about more than just average outcomes; they may value treatments that reduce their risk6 or treatments that increase the chance of a substantial gain, even when the mean improvement is relatively limited.7,8 (These findings reveal complex patient preferences for health risk that are captured in Generalized Risk-Adjusted Cost-Effectiveness, or GRACE).9-13 For clinical decision makers, average outcomes can conceal benefits to particular subpopulations.14 For policy makers, average outcomes shed no light on how new treatments affect societal inequality. Finally, payers and self-insured employers may wish to understand the risks of incurring above-average costs or deriving below-average clinical benefits.
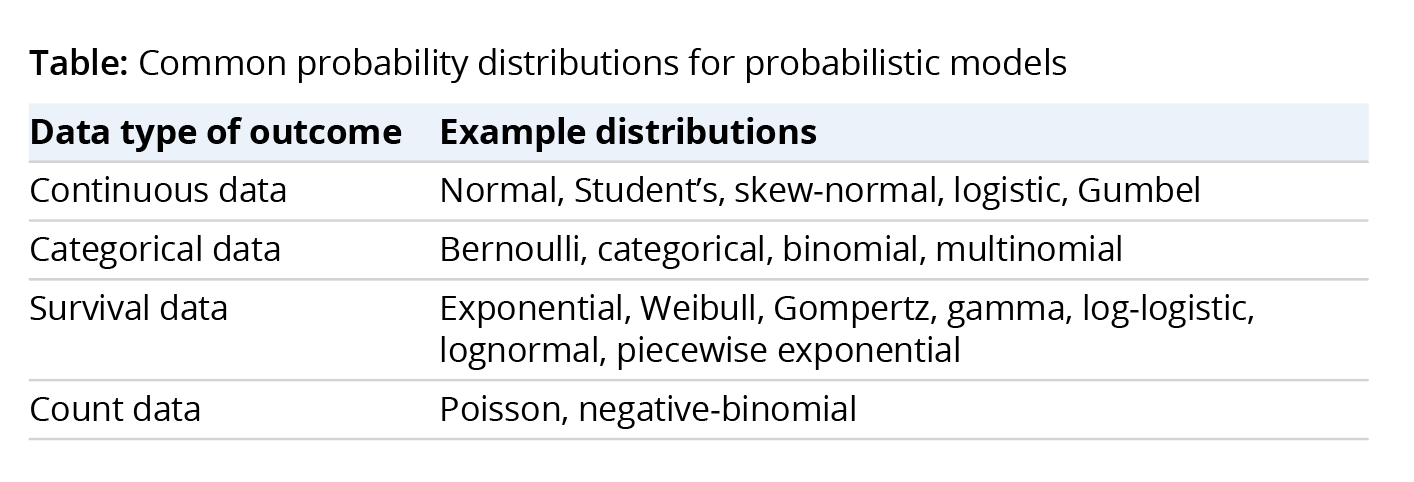
All these stakeholders are better served by using probabilistic models, which predict entire probability distributions rather than a narrow summary like the average.15 Examples of probability distributions for common types of outcomes are shown in the Table. As discussed below, Bayesian statistical models are particularly attractive because they are inherently probabilistic and quantify multiple sources of uncertainty.
To illustrate the practical estimation of probabilistic models, we studied disease progression in patients with DMD using the North Star Ambulatory Assessment (NSAA) total score, which reflects patient performance on 17 tasks to measure functional motor ability.i We measured losses in total score from baseline and reported them in 4 categories (0, 1-2, 3-5, and 6+). We then predicted the distribution of losses in total score from baseline.
Learning from machine learning
It is often not obvious what model(s) or variables to use when forming predictions. When used properly, machine-learning approaches can inform these decisions by using data to determine which modeling choices result in the best predictions of salient outcomes distributions.16
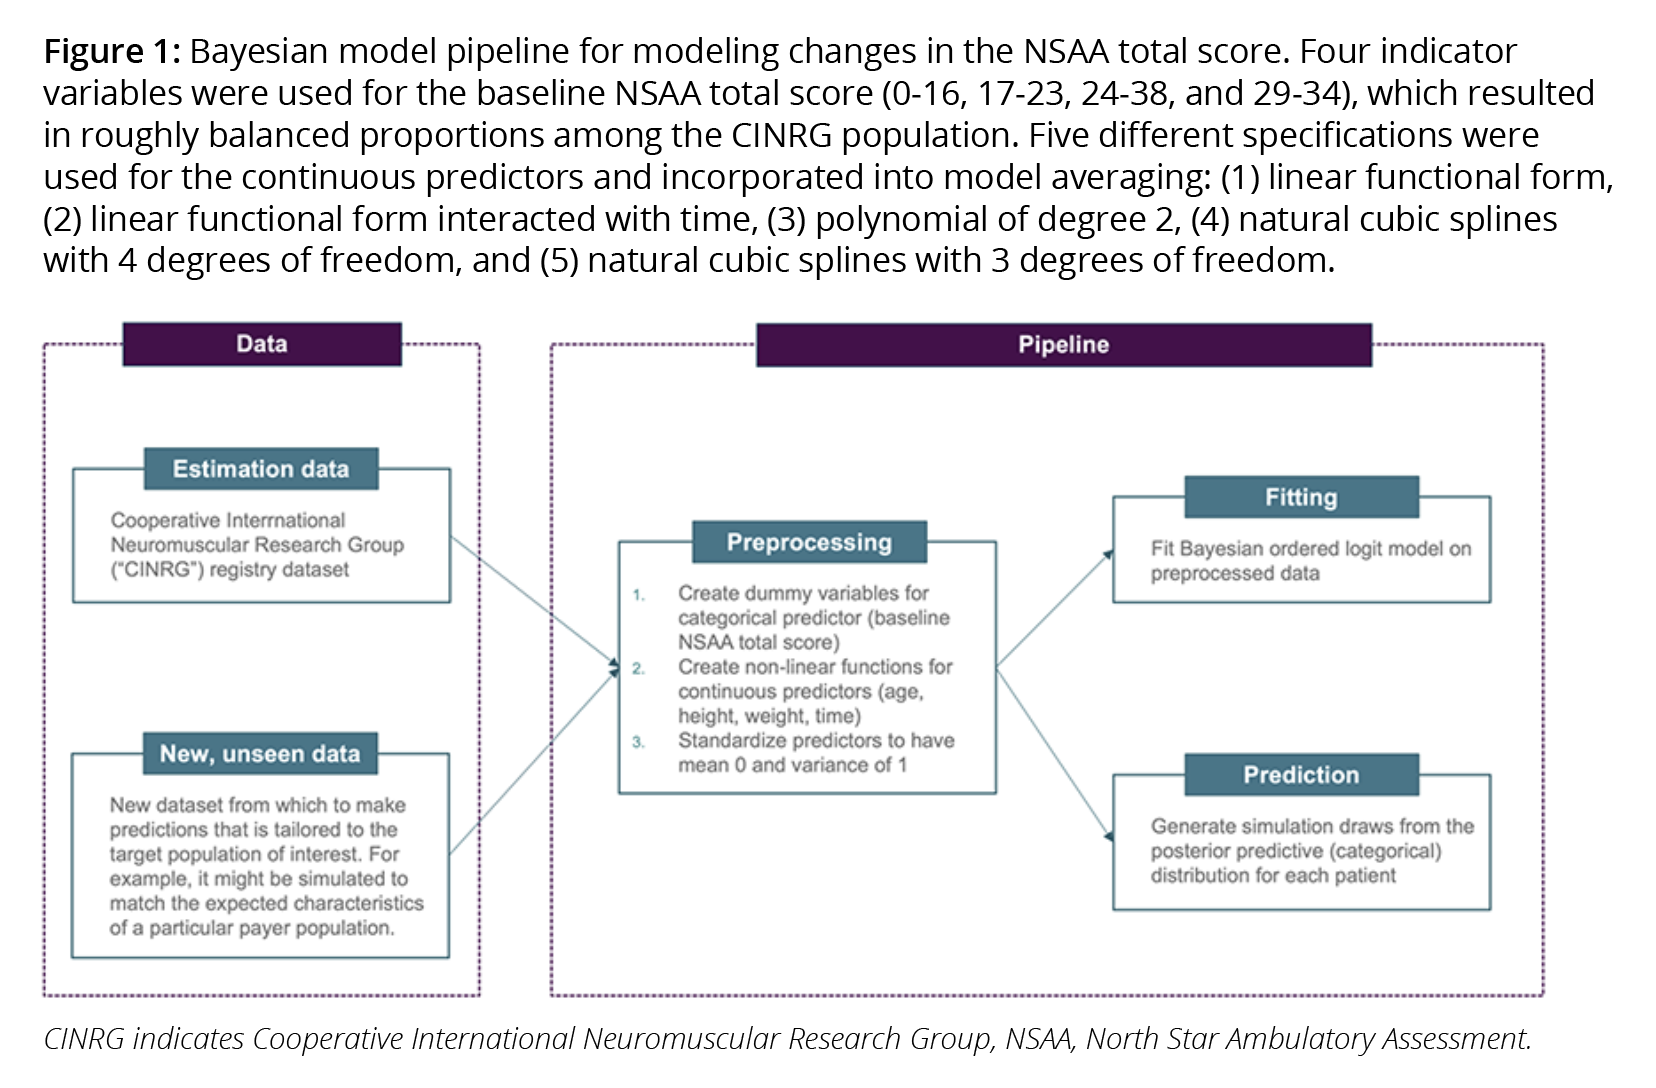
Best practice in machine learning combines all model-building steps into a single automated process known as a pipeline,17 which combines the statistical model relating inputs to outputs with all preprocessing steps that prepare the inputs for model fitting. We refer to the full series of steps as a Bayesian model pipeline. Our DMD Bayesian model pipeline is shown in Figure 1.
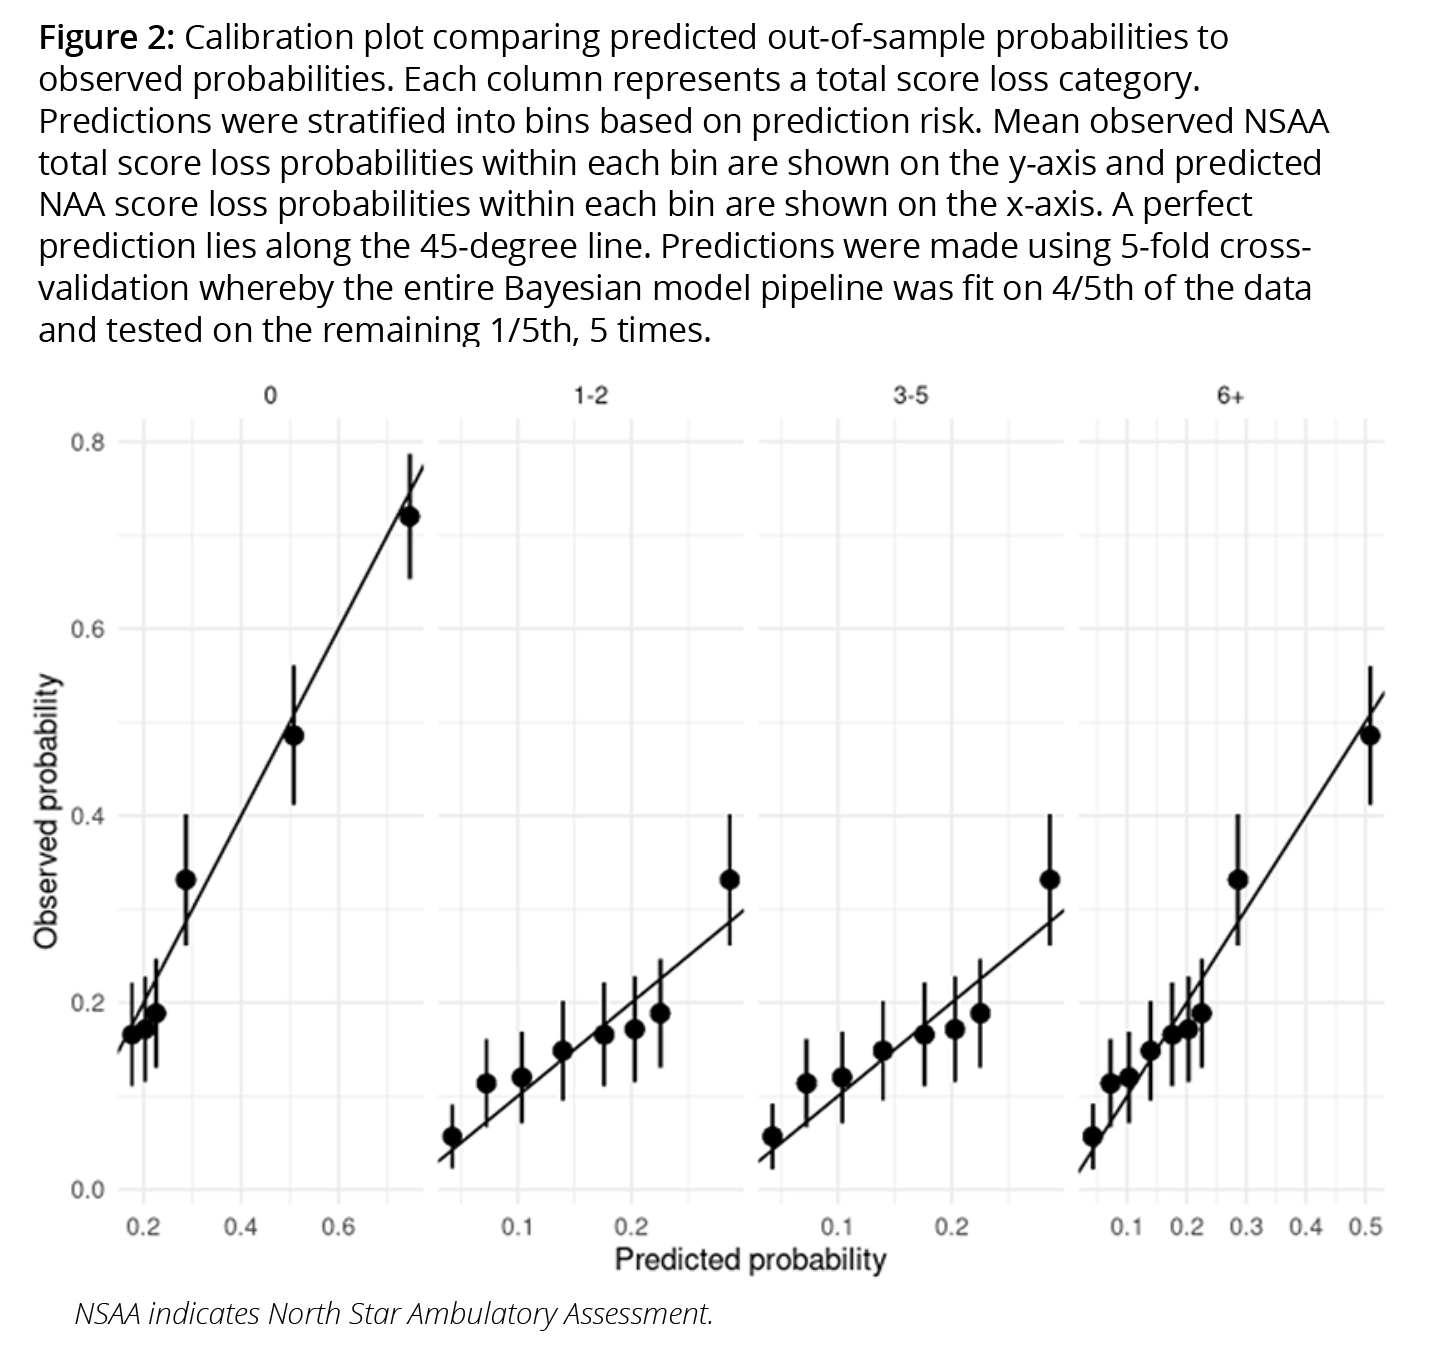
A pipeline produces numerous benefits. First, it makes the process of generalizing trial results to multiple target populations more transparent, more efficient, and less error prone. Second, it is well-suited to “Living HTA,”18 allowing value assessments to be updated in real-time as new data becomes available. Third, evaluations of a model on out-of-sample data are more reliable because the entire modeling process is included in the evaluation.16 Finally, pipelines ensure greater reliability when predicting outcomes for new populations that were not used to fit the model (ie, when performing “out-of-sample” predictions).16,19 As shown in Figure 2, we used a fresh sample of patients with DMD to assess whether out-of-sample predictions matched observed probabilities.
Quantifying multiple sources of uncertainty
Clinical, reimbursement, and pricing decisions are made against a backdrop of uncertainty. For example, the most cost-effective treatment is the one with the highest expected value when considering all sources of uncertainty. Furthermore, both decision makers’ confidence in cost-effectiveness analyses results and the value of collecting additional postreimbursement data depend on the probability that a treatment is cost-effective.
"Empirical research demonstrates that patients themselves care about more than just average outcomes."
There are 3 prevalent types of uncertainty in outcomes analysis. Structural uncertainty reflects uncertainty about which underlying model structure matches the real world (eg, whether the true model is linear or nonlinear). Parameter uncertainty reflects uncertainty about the values of individual model parameters (eg, the values of the regression coefficients or the probability of a successful outcome). Sampling uncertainty reflects uncertainty in the distribution of the outcome when measured in a finite population (eg, given a fixed probability of success, the number of patients in a payer population of size N that will succeed).ii
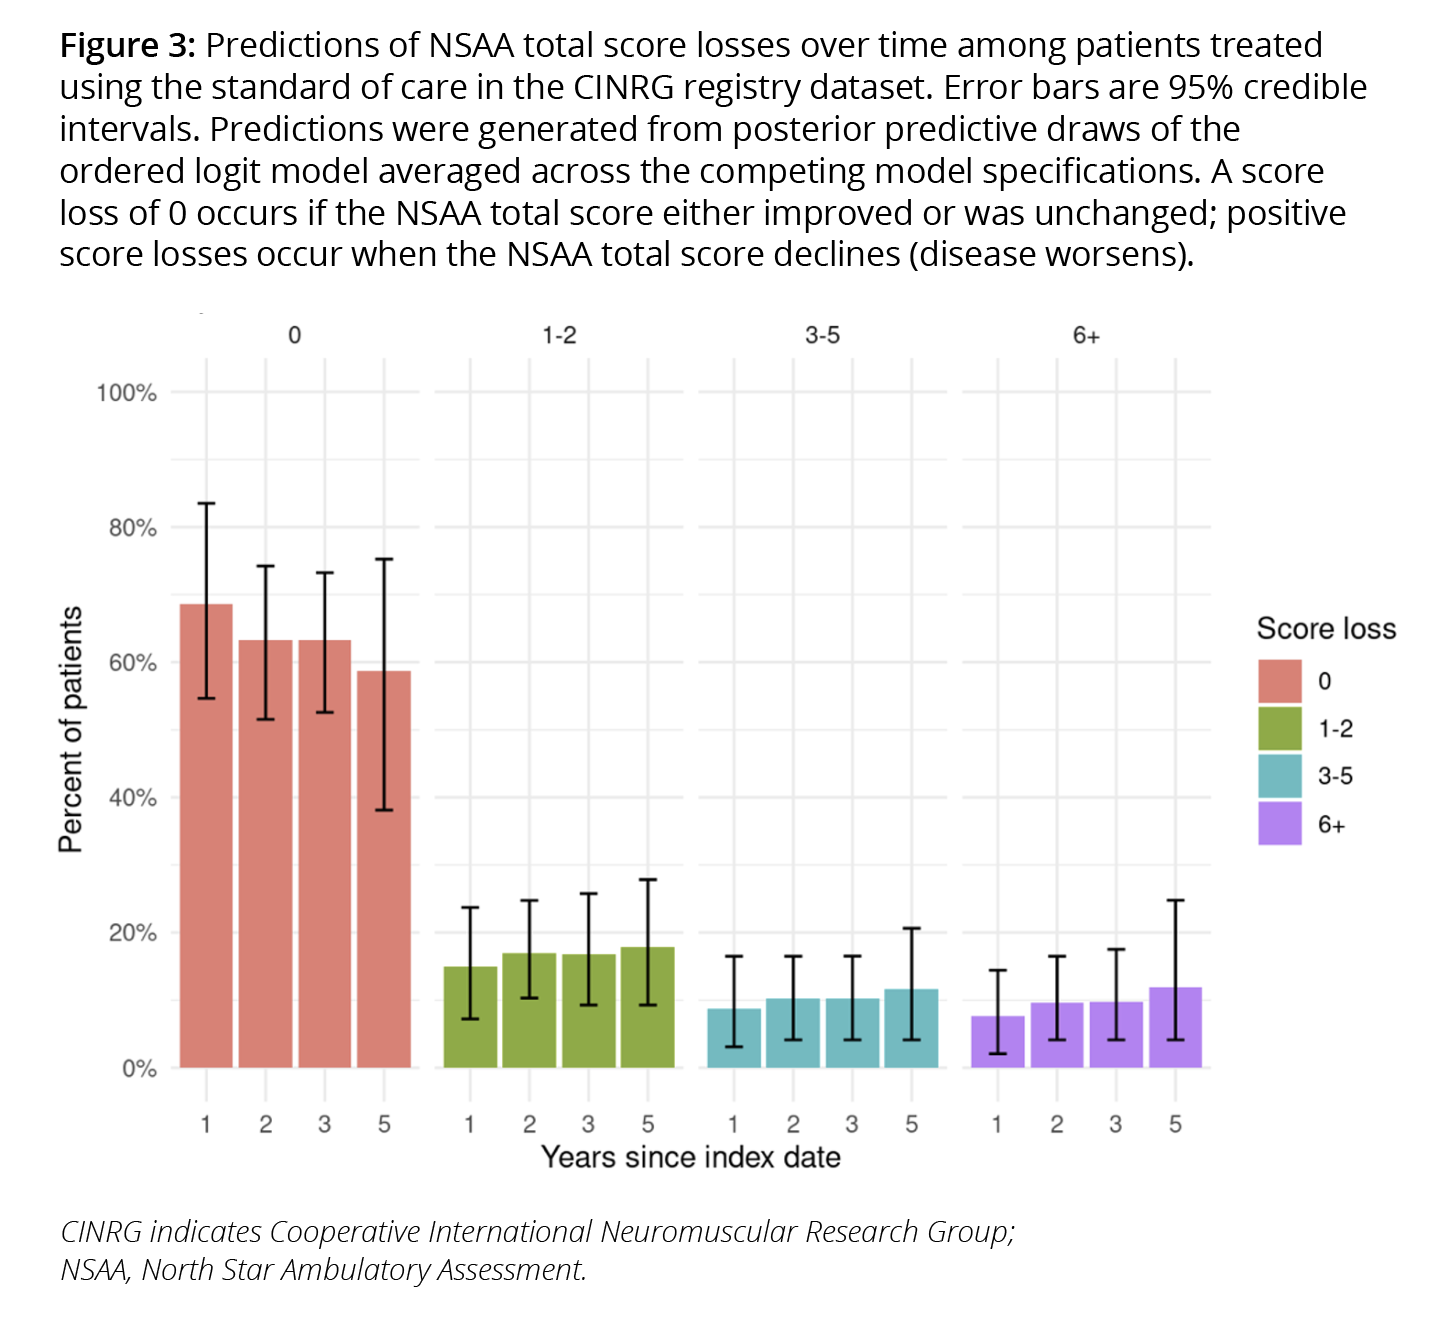
Predictions from our DMD model reflect all 3 sources. Multiple Bayesian models with different specifications of the predictors are assigned weights based on out-of-sample performance using Bayesian model averaging20 techniques (reflecting structural uncertainty). Posterior draws of the regression coefficients were generated for each model (reflecting parameter uncertainty). Changes in total scores for each patient are then simulated from a categorical distribution using the weighted models (reflecting sampling uncertainty). The predicted proportion of standard of care patients in each functional status category are shown in Figure 3.
The optimal use of real-world data
When a drug has not yet been launched, it may seem like real-world data (RWD) would be of little use since these are not available for the drug of interest. In fact, RWD can be quite useful in this context.
Randomized controlled trials (RCTs) are often lauded because they can estimate unbiased relative (novel treatment versus standard of care) treatment effects, while nonrandomized RWD studies are criticized for potential selection bias. These assessments are correct but incomplete. RWD, unlike RCTs, better represent real-world patients and thus better estimate baseline risk (ie, outcomes that obtain under a prevailing real-world standard of care). Thus, RCTs are ideal for causal inference, but RWD are best for prediction and external validity. Thankfully, analysts can benefit from the best of both worlds.
Relative treatment effects from RCTs and baseline risk from RWD can be optimally combined to estimate absolute clinical benefit using an approach called risk magnification.21 For instance, the predicted NSAA total scores for standard of care patients with DMD can be combined with an empirically derived odds ratio that reflects the relative treatment effect observed in an RCT. The result is a predicted treatment effect for the new drug that accounts for the characteristics of real-world patients with DMD using the current standard of care. This approach has been favored by statisticians who argue that relative treatment effects are less likely to vary across individuals than baseline risk.22iii Estimation of baseline risk is critical because absolute clinical benefits may vary considerably by baseline risk even if relative treatment effects are constant.
"Decision makers’ confidence in cost-effectiveness analyses results and the value of collecting additional post-reimbursement data depend on the probability that a treatment is cost-effective."
Making the most of limited data
Bayesian models require the analyst to specify “priors,” which reflect a priori beliefs about the distribution of parameters. Some criticize this requirement on the grounds that subjectively determined priors can heavily influence model estimates. Yet this criticism overlooks the way in which analysts and decision makers already use priors. “Classical” statistical approaches might subject a set of estimates to a “sanity check” from clinical or other experts and then reject the model if it fails to meet those clinical expectations. This process is itself subjective, arbitrary, and (often) nonreproducible. In contrast, a formal process of specifying priors imposes systematic and structured discipline on what would otherwise be an opaque and ad hoc process. And, priors improve predictive performance by incorporating external or expert views that would ordinarily be held separate from a model-estimation process.
Bayesian priors can be particularly helpful when sample sizes are small. In such cases, models are typically overfit to the available data resulting in poor out-of-sample predictions coupled with overoptimism about predictive performance. We mitigated this problem by using a “shrinkage” prior.23 Intuitively, the shrinkage prior leverages the result that historical data may mislead because performance above or below an average is likely to suffer regression to the mean.24 First proposed in the peer-reviewed statistics literature in the 1950s, the shrinkage prior rigorously accounts for this “regression to the mean” problem.25
Priors can also help combine disparate datasets or extrapolate to new patient populations. For example, historical clinical trials are often available for the standard of care, but there is a risk that combining them with RWD on standard of care patients will reduce the representativeness of the data. Priors can address this potential loss of representativeness, because the amount by which the RWD “borrows” from the trial data can be weighted by the extent to which outcomes in the trial data are like the RWD.26 Similarly, if there is a need to make predictions in an entirely new population (eg, in children after an initial study in adults), the new study (in children) can borrow from the data from the initial study (in adults), reducing the cost of data collection.27
The way forward
Better estimates of real-world value benefit almost all healthcare stakeholders. Coverage decisions by public and private payers will be based on economic analyses that better reflect their population and financial risk. Citizens will benefit from better decision making and more efficient clinical trials. Both payers and manufacturers can better assess their risk in outcomes-based contracts.
Unfortunately, the methods needed to generate such benefits are currently underused and underappreciated. One reason is that health economic models are typically divorced from the statistical methods and data used to parameterize them. This is a mistake; economic and statistical modeling should not be thought of as separate exercises, but as essential components of a unified and coherent model applied to predict real-world health outcomes. While statistical methods may seem complex, advances in machine learning have taught us how appropriate software can bring complex algorithms to practice.
References
- Food and Drug Administration. FDA grants accelerated approval for Alzheimer’s drug. June 7, 2021. Accessed August 1, 2024. https://www.fda.gov/news-events/press-announcements/fda-grants-accelerated-approval-alzheimers-drug
- Nania R. Medicare Limits Coverage of Controversial New Alzheimer’s Drug. April 8, 2022. Accessed August 1, 2024. https://www.aarp.org/health/medicare-insurance/info-2022/aduhelm-coverage.html
- Silverman E. Biogen’s pricey Alzheimer’s drug will fuel record premium hikes for Medicare Part B. November 15, 2021. Accessed August 1, 2024. https://www.statnews.com/pharmalot/2021/11/15/biogen-alzheimers-fda-medicare-medicaid/
- Centers for Medicare & Medicaid Services. Monoclonal antibodies directed against amyloid for the treatment of Alzheimer’s disease. Accessed August 1, 2024. https://www.cms.gov/medicare-coverage-database/view/ncacal-decision-memo.aspx?proposed=Y&NCAId=305
- Centers for Medicare & Medicaid Services. CMS announces new details of plan to cover new Alzheimer’s drugs. June 22, 2023. Accessed August 1, 2024. https://www.cms.gov/newsroom/fact-sheets/cms-announces-new-details-plan-cover-new-alzheimers-drugs
- Lakdawalla DN, Malani A, Reif J. The insurance value of medical innovation. J Public Econ. 2017;145:94-102.
- Lakdawalla DN, Romley JA, Sanchez Y, Maclean JR, Penrod JR, Philipson T. How cancer patients value hope and the implications for cost-effectiveness assessments of high-cost cancer therapies. Health Aff (Millwood). 2012;31(4):676-682.
- Shafrin J, Schwartz TT, Okoro T, Romley JA. Patient versus physician valuation of durable survival gains: implications for value framework assessments. Value Health. 2017;20(2):217-223.
- Lakdawalla DN, Phelps CE. Health technology assessment with risk aversion in health. J Health Econ. 2020;72:102346.
- Lakdawalla DN, Phelps CE. Health technology assessment with diminishing returns to health: the Generalized Risk-Adjusted Cost Effectiveness (GRACE) approach. Value Health. 2021;24(2):244-249.
- Lakdawalla DN, Phelps CE. A guide to extending and implementing Generalized Risk-Adjusted Cost-Effectiveness (GRACE). Eur J Health Econ. 2022;23(3):433-451.
- Lakdawalla DN, Phelps CE. The Generalized Risk-Adjusted Cost-Effectiveness (GRACE) model for measuring the value of gains in health: an exact formulation. J Benefit Cost Anal. 2023;14(1):44-67.
- Phelps CE, Lakdawalla DN. Methods to adjust willingness-to-pay measures for severity of illness. Value Health. 2023;26(7):1003-1010.
- Basu A, Jena AB, Philipson TJ. The impact of comparative effectiveness research on health and health care spending. J Health Econ. 2011;30(4):695-706.
- Carpenter B, Gelman A, Hoffman MD, et al. Stan: a probabilistic programming language. J Stat Softw. 2017;76(1):1-34.
- Hastie T, Tibshirani R, Friedman J. The Elements Of Statistical Learning: Data Mining, Inference, and Prediction. 2nd ed. 2009; Springer.
- Pedregosa F, Varoquaux G, Gramfort A, et al. Scikit-learn: machine learning in Python. J Mach Learn Res. 2011;12:2825-2830.
- Thokala P, Srivastava T, Smith R, et al., Living health technology assessment: issues, challenges and opportunities. PharmacoEconomics. 2023;41(3):227-237.
- Harrell FE Jr. Regression Modeling Strategies. Bios 330. 2017;14.
- Yao Y, Vehtari A, Simpson D, Gelman A. Using stacking to average Bayesian predictive distributions (with discussion). Bayesian Anal. 2018;13(3):917-1007.
- Rekkas A, Paulus JK, Raman G, et al. Predictive approaches to heterogeneous treatment effects: a scoping review. BMC Med Res Methodol. 2020;20(1):1-12.
- Harrell FE, Jr. Viewpoints on Heterogeneity of Treatment Effect and Precision Medicine. Library Catalog. Published June 4, 2018. Modified August 25, 2024. https://www.fharrell.com/post/hteview/
- Piironen J, Vehtari A. Sparsity information and regularization in the horseshoe and other shrinkage priors. Electron J Statist. 2017;11(2): 5018-5051.
- Efron B, Morris C. Stein’s paradox in statistics. Scientific American. 1977;236(5):119-127.
- Stein C. Inadmissibility of the Usual Estimator for the Mean of a Multivariate Normal Distribution, in Proceedings of the Third Berkeley Symposium on Mathematical Statistics and Probability. University of California Press. 1956:197-206.
- Viele K, Berry S, Neuenschwander B, et al. Use of historical control data for assessing treatment effects in clinical trials. Pharm Stat. 2014;13(1):41-54.
- Gamalo-Siebers M, Savic J, Basu C, et al. Statistical modeling for Bayesian extrapolation of adult clinical trial information in pediatric drug evaluation. Pharm Stat. 2017;16(4):232-249.
i Each task is scored from 0 (worst) to 2 (best) so the total score ranges from 0 to 34.
ii Sampling uncertainty may only be relevant in some contexts. For instance, CEAs should arguably estimate average outcomes in an infinitely large population and therefore eliminate sampling uncertainty. On the other hand, sampling uncertainty is relevant in budget impact analyses because costs accrue among a population of a fixed size (forecasts of costs for rare disease will surely be more uncertain than forecasts of costs in highly prevalent diseases).

